
A map dealer’s catalogue is not the first place you’d expect to be a locus of resistance. Even so, in the first 2026 catalogue from map dealer Neatline Maps, Kristoffer Damgaard curates a selection of Greenland-focused material, along with a ten-page history of the mapping and exploration of Greenland. “Understanding how Greenland was explored and mapped over time provides an important context for understanding why the present confrontation is so deeply unnecessary and wrong.” Thanks to Fred for the tip.
Tag: Greenland
Greenland, the Mercator, and You-Know-Who
Somebody’s been talking about Greenland again, and we’re getting another flurry of articles about how Greenland’s apparent size on maps may be to blame for the obsession. Last year it was suggested that Trump wanted Greenland simply because it looked really big on the Mercator projection: Slate and Newsweek were a lot less circumspect about it than Foreign Policy was, but then they would be. The latest round of press appears to be equally circumspect. The Financial Times and Geographical magazine turn evidence of executive ignorance into some kind of teachable moment about map projections instead of saying outright: he thinks it’s bigger than it actually is, and that’s nuts. Providing some context is always good, but let’s try not to bury the lede.
Most people know the poles are exaggerated on the Mercator projection. They’ve seen other projections. In Rhumb Lines and Map Wars, Mark Monmonier pushed back against the argument that map projections distort our understanding of geography: “Do they never look at a globe, or at other maps? Are map users complete idiots?”1 It was a rhetorical question: of course they aren’t, he was saying. Apparently there’s an exception. But when the emperor has no clothes, you have to proceed as though most people run around naked.
Previously: Trump’s ‘Cartographic Compulsion’.
xkcd on Greenland’s Size
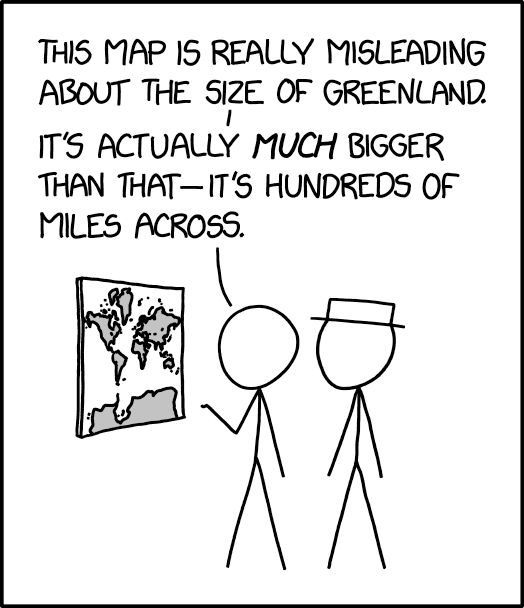
The 25 March 2024 xkcd honours Greenland’s place as a measure of cartographic distortion. It’s also, unexpectedly, a riff on the idea of the 1:1 scale map (cf. Borges), especially if you consult the comic’s alt text: “The Mercator projection drastically distorts the size of almost every area of land except a small ring around the North and South Poles.”
Previously: xkcd: The Greenland Special.
xkcd: The Greenland Special

At some point, xkcd cartoonist Randall Munroe is going to put out a book focusing on his map-related cartoons, isn’t he. The latest in his “Bad Map Projection” series (previously: All South Americas, Time Zones, Liquid Resize) is The Greenland Special, an equal-area projection except for Greenland, which uses Mercator. And I thought he was messing with us before.
New Map of Greenland and the European Arctic

The British Antarctic Survey—which despite its name focuses its attention on both polar regions—has released a new one-sheet map of Greenland and the European Arctic. The 1:4,000,000-scale map covers a region from Baffin Island to Novaya Zemlya to Scotland: a region that’s usually on the edges of maps of the Arctic and Europe rather than getting its own map. More importantly, it’s a very recent snapshot of a rapidly changing region: the retreating ice sheet in Greenland is revealing new landscapes. The map costs £12 and is available either folded or rolled from Stanfords and the Scott Polar Research Institute. [BBC]
New Maps Show Greenland’s Glaciers at Risk
 NASA’s Jet Propulsion Laboratory: “New maps of Greenland’s coastal seafloor and bedrock beneath its massive ice sheet show that two to four times as many coastal glaciers are at risk of accelerated melting as previously thought. Researchers at the University of California at Irvine (UCI), NASA and 30 other institutions have published the most comprehensive, accurate and high-resolution relief maps ever made of Greenland’s bedrock and coastal seafloor. Among the many data sources incorporated into the new maps are data from NASA’s Ocean Melting Greenland (OMG) campaign.”
More Detailed Maps of Greenland Coming Soon
The Arctic Journal reports on recent efforts to produce more detailed, systematic and accurate maps of Greenland.
Danish officials today announced promising initial results of a project using satellites to collect cartographic data faster and more efficiently than has been possible using aeroplanes.
The project involved using SPOT 6 and 7, two commercially operated European satellites, flying at an altitude of 700km to collect images of four specific areas […]. The pictures they returned over a two-year period beginning in 2015 each measure 360 square km. Objects as small as 1.5 m can be discerned in the pictures, making them detailed enough to be used to make precise, high-resolution maps.
Cartographers are now in the process of turning the data into finished, on-line maps. The maps themselves are expected to publicly available by autumn. But, even before that, the data gathered by the satellites will be placed on-line.
[WMS]
The Last Unmapped Places
Lois Parshley’s essay on the last unmapped, mysterious places—Greenlandic fjords, the slums of Haiti, the ocean’s depths, black holes in space—is a long read worth reading. Originally published last month as “Here Be Dragons: Finding the Blank Spaces in a Well-Mapped World” in the Virginia Quarterly Review, it’s been reprinted by the Guardian, in an edited, tighter version, as “Faultlines, Black Holes and Glaciers: Mapping Uncharted Territories.”
Map of Thawed Areas Under Greenland’s Ice Sheet

NASA: “NASA researchers have helped produce the first map showing what parts of the bottom of the massive Greenland Ice Sheet are thawed— key information in better predicting how the ice sheet will react to a warming climate.”