
Reuters: “A U.S. mining company backed by billionaires Jeff Bezos and Bill Gates is in a tangle with Belgium’s AfricaMuseum over who should digitise antique maps of what is now the Democratic Republic of Congo in the museum’s archive.” The colonial-era records in question take up some 500 metres of shelving and are already being digitized under a separate project with the DRC. The AfricaMuseum says it can’t hand the records over to a private company; the mining startup, KoBold Metals, also has an agreement with the Kinshasa government to digitize the data. [Tara Calishain]
Category: Geology
A New Map of Antarctica Suggests a Complex Landscape Under the Ice Sheet
A new, far more detailed map of the landscape underneath Antarctica’s ice sheet, generated “by applying the physics of ice flow to ice surface maps and incorporating geophysical ice thickness observations.” There’s an aspect of speculation, of inference, to this method—the map is predicated on our understanding of how ice flows, and that understanding may change. But in the meantime the new map is suggesting the existence of some under-ice landforms hitherto undiscovered. BBC News, Reuters.
Previously: A New Map of the Land Beneath Antarctica’s Ice.
USGS Announces New National Geologic Map

The USGS announced a new, more detailed national geologic map last week.
The new USGS map, called The Cooperative National Geologic Map, was created using more than 100 preexisting geologic maps from various sources and is the first nationwide map to provide users with access to multiple layers of geologic data for one location. This feature allows users to access the multiple data sources included in the map to look at or beneath the surface to understand the ancient history of the nation recorded in rocks.
Of note: the USGS cites automated processes to speed up the integration of data from its various sources (e.g., state geologic surveys), resulting in a new map after only three years of development.
Everything You Ever Wanted to Know About the 29 July 2025 M 8.8 Kamchatka Earthquake

The USGS has posted a “geonarrative” (i.e., a StoryMap) that delves into great detail about the seismology of the magnitude 8.8 earthquake that took place on 29 July 2025 off the Kamchatka Peninsula, providing history, context and so many detailed maps about the event. [Ryan Hollister]
A New Map of the Land Beneath Antarctica’s Ice

The British Antarctic Society has announced the release of Bedmap3, the third and twice-as-detailed topographic model of the landscape beneath the Antarctic ice sheet.
Bedmap3, as the name suggests, is the third attempt to draw a picture of Antarctica’s rock bed that began in 2001, but this new effort represents a dramatic refinement. It includes more than double the number of previous data points (82 million), rendered on a 500 m grid spacing.
Big knowledge gaps have been filled by recent surveys in East Antarctica, including around the South Pole, along the Antarctic Peninsula and West Antarctic coastlines, and in the Transantarctic Mountains.
The outline of deep valleys is better represented. So too are those places where rocky mountains stick up through the ice. The latest satellite data have also more accurately recorded the height and shape of the ice sheet and the thickness of the floating ice shelves that push out over the ocean at the continent’s margin.
For crunchier details, see the article in Scientific Data.
Previously: Mapping Antarctica’s Bedrock.
Chinese Academy of Sciences Releases 1:2,500,000 Geologic Maps of the Moon

Last month the Chinese Academy of Sciences released a set of geologic maps of the moon at 1:2,500,000 scale—twice the resolution of the USGS’s 1:5,000,000 scale maps. Available, it seems, as a geologic atlas as well as quadrangle maps—though it’s not immediately apparent from where. News: Nature, Popular Science, Universe Today.
Visualizing Continental Drift, Typographically
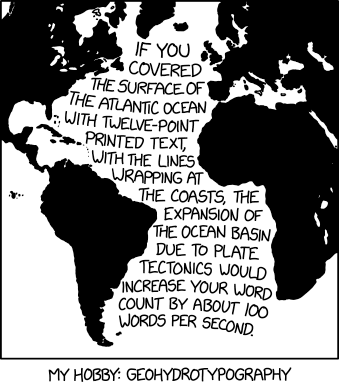
Well, that’s one way to visualize the rate of continental drift.
Large-Scale Geologic Maps of Mars

The USGS’s Astrogeology Science Center highlights three geologic maps of Mars released in late 2021. The maps are large-scale, focusing on specific Martian features (e.g. Olympus Mons, above).
Though maps have historically covered large areas, with crewed lunar missions on the horizon and other missions across the solar system in the planning stages, large-scale, small-area maps are starting to steal the limelight. These large-scale, small-area maps provide highly detailed views of the surface and allow scientists to investigate complex geologic relationships both on and beneath the surface. These types of maps are useful for both planning for and then conducting landed missions.
The maps are of Olympus Mons Caldera, Athabasca Valles and Aeolis Dorsa. Interactive versions, with toggleable layers over spacecraft imagery, are also available: Olympus Mons Caldera, Athabasca Valles, Aeolis Dorsa.
Mapping the Watery Past of Mars

A new map of Mars reveals the abundance of aqueous minerals—clays and salts that form in the presence of water—that were created during the planet’s distant watery past. “The big surprise is the prevalence of these minerals. Ten years ago, planetary scientists knew of around 1000 outcrops on Mars. This made them interesting as geological oddities. However, the new map has reversed the situation, revealing hundreds of thousands of such areas in the oldest parts of the planet.”
‘The People Who Draw Rocks’
Melting glaciers are keeping a special team of cartographers at Swisstopo, Switzerland’s national mapping agency, busy: they’re the ones charged with making changes to the Swiss alps on Swisstopo’s maps. The New York Times reports:
“The glaciers are melting, and I have more work to do,” as Adrian Dähler, part of that special group, put it.
Dähler is one of only three cartographers at the agency—the Federal Office of Topography, or Swisstopo—allowed to tinker with the Swiss Alps, the centerpiece of the country’s map. Known around the office as “felsiers,” a Swiss-German nickname that loosely translates as “the people who draw rocks,” Dähler, along with Jürg Gilgen and Markus Heger, are experts in shaded relief, a technique for illustrating a mountain (and any of its glaciers) so that it appears three-dimensional. Their skills and creativity also help them capture consequences of the thawing permafrost, like landslides, shifting crevasses and new lakes.
The article is a fascinating look at an extraordinarily exacting aspect of cartography. [WMS]
Alaskan Ice in Retreat
This NASA Earth Observatory video looks at the retreat of Alaska’s Columbia Glacier since 1986. Transcript here.
Cross-stitched Earth Science Maps
Kara Prior cross-stitches earth science maps; her work includes a series of state bedrock geology maps (see also Reddit) and a bathymetry map of the Great Lakes (above), among other things. She has an Etsy store.
VERITAS Mission to Map Venus Later This Decade

VERITAS is one of two missions to Venus announced by NASA last week. Expected to launch between 2028 and 2030, VERITAS will produce an improved map of the Venusian surface with its two instruments: synthetic aperture radar to generate a high-resolution 3D topographic map, and a spectral emissions mapper to map rock types. News coverage: CNN, Global News, Slate, The Verge. Background from NASA; analysis from the Planetary Society.
Historical Landslides in Canada

The third edition of a map showing landslides that have caused fatalities in Canada since 1771, created over six years by Geological Survey of Canada research scientist Andrée Blais-Stevens, was recently released. The Ottawa Citizen has the story; the map in question can be downloaded in PDF format here (48.7 MB).
One Billion Years of Continental Drift
So this animation went viral last week:
Pretty amazing full plate tectonic animation of the last billion years from @AndrewMerdith – Merdith et al. 2021 (Earth Science Reviews) @MullerDietmar @EarthByteGroup @UniAdelSciences https://t.co/Plne1y1Qm7 pic.twitter.com/IIFGRaZ3vD
— Alan Collins (@geoAlanC) January 29, 2021
It shows the movement of Earth’s tectonic plates over the past billion years, and it was posted by one of the co-authors of this study proposing a new, single model of plate tectonic activity that covers the past billion years of Earth’s existence. (Previous models, if I understand the abstract correctly, covered shorter periods—for several-hundred-million-year values of short—and didn’t line up with each other.)