
Fantasy Maps: Imagined Worlds, a new exhibition at St. Louis’s Central Library, features enlarged prints of fantasy maps and a 75×25-foot illustrated map of St. Louis on the floor of the library’s great hall. Opens today and runs until 15 October according to this page. There’s nothing on the library’s website, but see the writeup in the St. Louis Post-Dispatch. [WMS]
Author: Jonathan Crowe
Jonathan Crowe blogs about maps at The Map Room. His essays and reviews have been published by AE, Calafia, The New York Review of Science Fiction, the Ottawa Citizen, Strange Horizons and Tor.com. He lives in Shawville, Quebec.
Konovalov’s Paris Métro Map
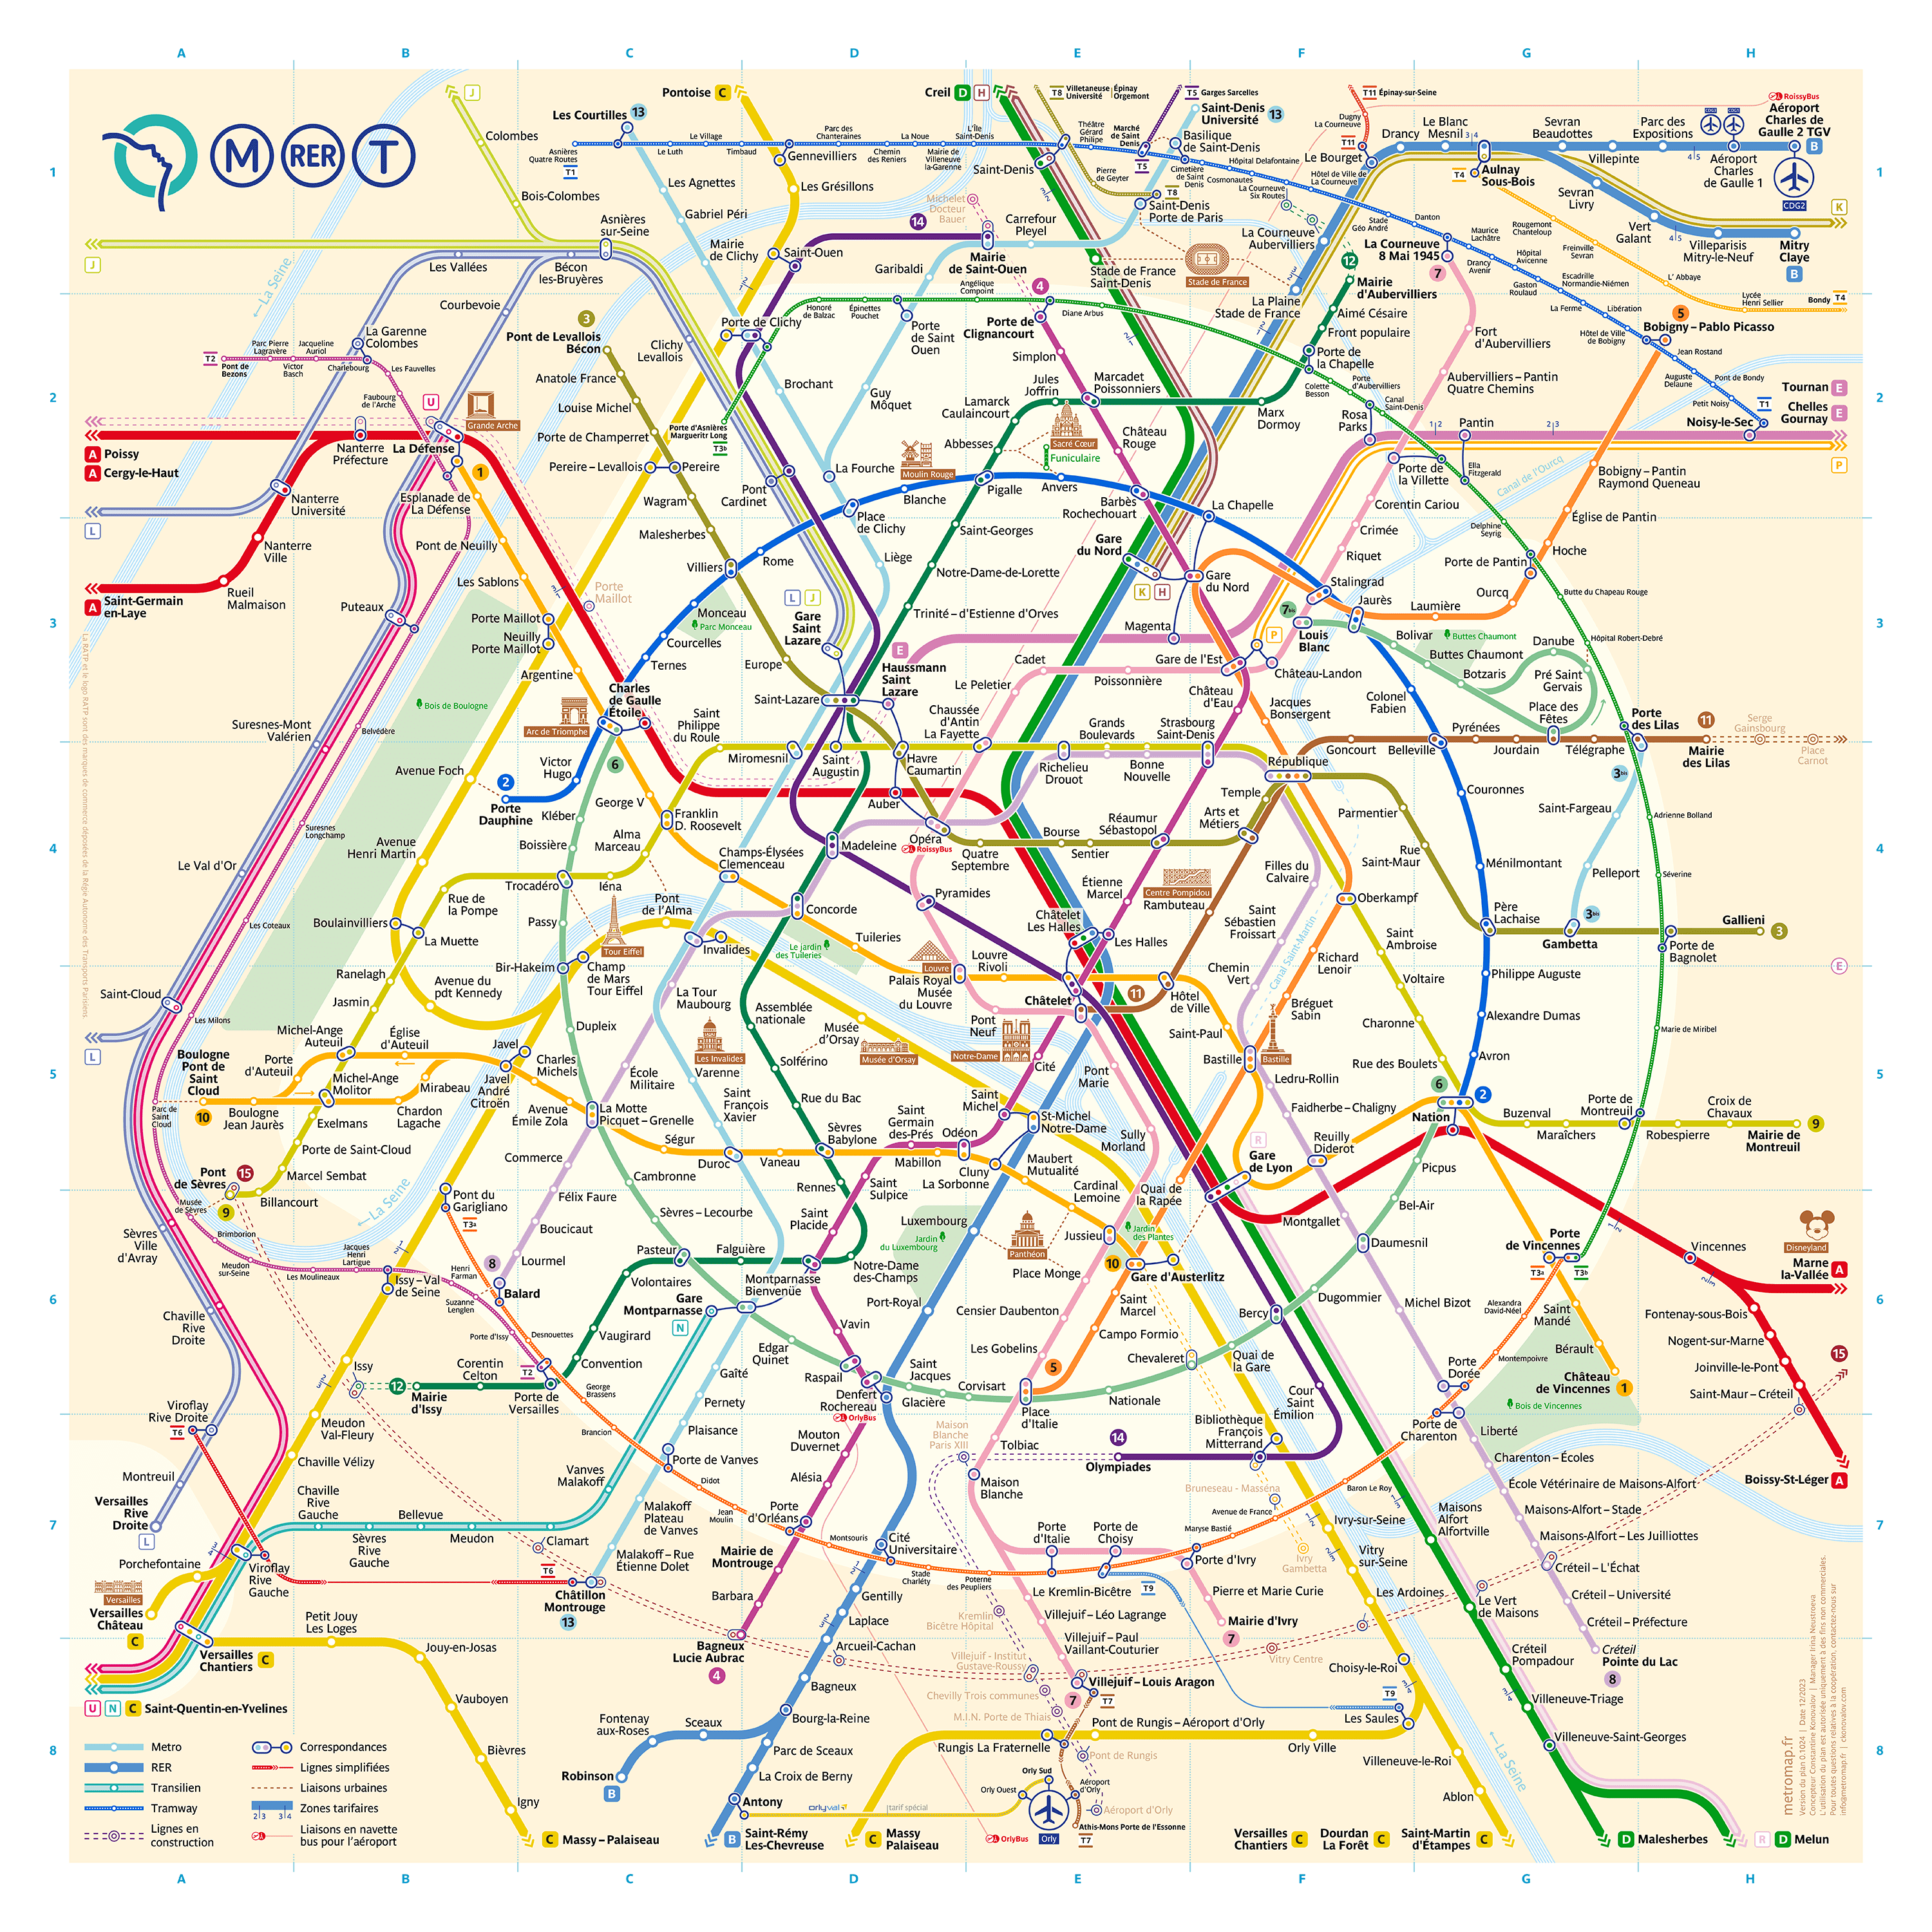
Designer Constantine Konovalov and his team spent more than two years creating this reimagined map of the Paris Métro system. Its design is based on circles: lines 2 and 6, which encircle the city core, are presented as a perfect circle, and the tramlines that follow the Péripherique form a circular arc as well. It’s quite well done; don’t miss the video on the site that timelapses through every iteration of the map’s design. Could someone navigate the RATP’s network with this map? I think so (though it’s been 19 years since I’ve been to Paris). See also Transit Maps’ analysis of the map.
The Chicago Tribune Reviews Two Map Books

 Writing for the Chicago Tribune, Patrick Reardon reviews two map books I’ve mentioned before, albeit briefly: Cartographic Grounds: Projecting the Landscape Imaginary, edited by Jill Desimini and Charles Waldheim, which comes out in a few days; and Mind the Map: Illustrated Maps and Cartography, edited by Antonis Antoniou, Robert Klanten and Sven Ehmann, which came out last September. “Each of these books aims to show a wide spectrum of map-making,” writes Reardon, “and together they cover just about the entire waterfront.” [WMS]
Previously: Cartographic Grounds; Mind the Map.
Don’t Make a Map
Martin Burch, data developer for the Wall Street Journal, has posted his presentation from the GeoJourNews 2016 conference. Called “Don’t Make a Map,” it explores situations where presenting your data in the form of a map is actually a bad idea, and looks at some better alternatives. “Always make a map,” he concludes, “but don’t always publish it.” Very much in the vein of similar pieces by Darla Cameron (of the Washington Post) and Matthew Ericson (of the New York Times). [Carla Astudillo]
Previously: The End of Maps in Seven Charts.
The Newberry Library’s Rand McNally Photos
The Newberry Library has uploaded some 400 photographs from their Rand McNally and Company collection. The photos, most of which date from the mid-20th century, chronicle various aspects of the company’s mapmaking business. [WMS]
Cartographic Grounds
 Next week sees the publication of Cartographic Grounds: Projecting the Landscape Imaginary by Jill Desimini and Charles Waldheim (Princeton Architectural Press). From the publisher: “While documenting this shift in representation from the material and physical description toward the depiction of the unseen and often immaterial, Cartographic Grounds takes a critical view toward the current use of data mapping and visualization and calls for a return to traditional cartographic to reimagine the manifestation and manipulation of the ground itself.” Cartographic Grounds’ ten chapters each focus on one cartographic technique; each of these techniques is illustrated in Atlas Obscura’s post last month about the book. [Benjamin Hennig]
Comparing Google and Apple Map Styles
Justin O’Beirne, who has previously mused about the possibility of a Universal Map and looked at how Google Maps has changed over the past few years, has now embarked on a multi-part comparison of the cartographic designs of Google Maps and Apple Maps. “We’ll take a look at what’s on each map and how each map is styled, and we’ll also try to uncover the biggest differences between the two.” The first part is already up: it looks at city labels, highway markers, road labels, and points of interest, and reveals some interesting divergences in terms what each platform chooses to put on the map. (Note that it’s a very big page, and even on a fast connection the images may take some time to load.) [Cartophilia]
An Ordnance Survey Roundup
- Scottish newspaper The Courier has a somewhat belated piece on the 80th anniversary of the Ordnance Survey’s trig pillars.

- Concomitant with the Survey’s map of Mars was a competition to design a map symbol to represent landing sites. The winner has been announced: the OS will use Paul Marsh’s symbol, which incorporates the Mars symbol with landing gear, on its Mars maps in the future.
Telluride Museum Map Exhibition Opens
Opening today at the Telluride Historical Museum in Telluride, Colorado and running until next March, Treasure Maps: Cartography of the American Southwest focuses on the mapmakers of the region and includes an augmented reality sandbox (presumably one like this one) to create relief maps in real time. The Telluride News reports. [WMS]
Eduard Imhof Profile
A profile of Swiss cartographer Eduard Imhof, famous for his work on relief mapping, from a 1983 Swiss TV program. Captioned in English if you can’t understand Swiss German for some reason. (Thanks to Henrik Johansson for the link.)
More on Imhof at Relief Shading, Terrain Models and Wikipedia.
Previously: Imhof’s Cartographic Relief Presentation; Codex 99 on Berann, Imhof and Everest.
Gettysburg Electric Map Reopens Tomorrow
How about that. The Electric Map of Gettysburg, now installed at the Hanover Heritage Conference Center in Hanover, PA, is opening tomorrow as scheduled. I should never have doubted them. [WMS]
Previously: Gettysburg Electric Map to Reopen in June; The Return of the Electric Map.
The W. K. Morrison Special Collection

Nova Scotia Community College’s Centre of Geographic Sciences has begun digitizing the maps from the W. K. Morrison Special Collection. Morrison, once a cartographer at the Centre, left them his collection of more than 2,500 maps when he died in 2011.
It is a mixed media print collection of historical maps, atlases, periodicals and books that is unique in the Province in terms of its focus on the early mapping of Nova Scotia and specifically the 18th Century nautical charts of J.F.W. DesBarres’ Atlantic Neptune. The collection also contains a complete run of the Gentleman’s Magazine from 1731-1802, and other early European periodicals containing maps not present in other collections. In addition to the maps that cover the advances in geographic knowledge over five centuries, there are a number of important atlases dating from the 18th and 19th Centuries as well as an interesting collection of Nova Scotiana from the 19th and early 20th centuries.
So far about 270 maps have been digitized; they’re available here. Media release (from last December), Chronicle Herald. [WMS]
The Great Lines Project
With the Great Lines Project, Karen Rann explores the history and origins of the contour line. In addition to her rather heavily illustrated blog, there’s a related exhibition, the Great Lines Exhibition (naturally enough), which opens today at the Lit & Phil (Literary and Philosophical Society) in Newcastle. Free admission. Details here and here. [WMS]
Update, 9 June: More from CityLab.
A funny quirk of social media is that despite having more followers on Twitter than Facebook (4,100 vs. 2,400 at the moment), and even with Facebook algorithms that seem to reduce page views for any post with commercial intent (e.g. product links) so you can pay to boost it, The Map Room consistently gets twice as much traffic from Facebook as it does from Twitter. Go figure. (Google+ traffic is 10 percent Facebook’s; Tumblr’s is a rounding error.)
A-Z Adventure Atlas Series
 London Hiker reviews the A-Z Adventure Atlas series of maps. “They contain 1:25,000 scale Ordnance Survey maps, but in a book format, like the A-Z street map books you’re probably used to. […] Many of the new A-Z style map books are extremely convenient and are fast becoming a favourite with me, depending on the circumstances.”