
 A Turkish filmmaker is working on a documentary about the life of Ottoman admiral and mapmaker Piri Reis, whose 1513 portolan chart, a fragment of which was rediscovered in 1929, claimed to draw upon ancient and contemporary sources, including Columbus. According to the Doğan News Agency story, the 75-minute film “will feature dramatic reconstructions starring actor Mehmet Günsur as Piri Reis, Riccardo Scamarcio as Christopher Columbus and actress Deniz Özdoğan. Can Atill will reportedly compose the music for the film.” If you can read Turkish, the website of the filmmaker, Gülsah Çeliker, is here; the movie’s website is here. The documentary is supposed to be finished by the end of the year. [WMS]
Emil Letoschek’s Weather Map

Federerico Italiano unearths a scarily abstract 1888 weather map of Europe by Emil Letoschek that is nevertheless intelligible (at least if you read German).
The Lost Art of Asking for Directions
“If my parents lamented a generation lost to knowing how to read a paper map, I’m wondering if mine will note the loss of one who doesn’t need the people of the places it passes through,” writes Lorraine Sommerfeld in a piece for Postmedia’s Driving that celebrates the advantages of asking locals for directions rather than relying on your car’s navigation system.
Wildflowers of Canada

“Wildflowers of Canada” is a limited-edition print released by Nova Scotia artist Sarah Duggan to celebrate Canada’s 150th birthday. Duggan also has a number of other examples of floral map art, in the shape of Canadian provinces (plus Cape Breton Island), on her Etsy store.
The Algonquian Linguistic Atlas
The Algonquian Linguistic Atlas, a collaborative, interactive web-based map that provides phrases in various indigenous languages in Canada, has earned its project director, Carleton University linguistics professor Marie-Odile Junker, a Governor General’s Innovation Award, CBC News reported in May.
Map of the North Circumpolar Region

At the CCA’s annual conference earlier this year, Natural Resources Canada launched its updated map of the North Circumpolar Region, which “shows the geography of the northern circumpolar region, north of approximately 55 degrees, at a scale of 1:9 000 000. The map uses the azimuthal equidistant projection. It includes all international boundaries, as well as the Canadian provincial and territorial boundaries and Canada’s 200 nautical mile offshore exclusive economic zone. National capital cities are shown, as are other cities, towns, villages and hamlets. Some seasonally populated places are also included. The map displays a number of significant northern features, including the median sea ice extent for September 1981 to 2010, the tree line, undersea relief, land relief, the Magnetic North Pole, glaciers, ice fields and coastal ice shelves. Many of the physiographic and hydrographic features are labelled.” [Cartophilia]
Observatory Books’s Stock Inventoried
If you were wondering what happened to Observatory Books’s inventory after it closed its doors last November, the Juneau Empire has the story: it took more than three months for historian Patti David to sift through “every map cabinet and stack of paper in every corner of the bookstore”; the store’s collection of Alaskana will be shipped to Seattle to make it easier for collectors to purchase. [WMS]
Franklin Expedition’s Secret Map Available via Access to Information
To deter looters, the locations of the wrecks of the Franklin expedition are a closely guarded secret. Except for one thing: a map showing the precise location of the wreck of the HMS Terror can be had via an access-to-information request. Two such requests have been made already.
‘Original’ Disneyland Map to Be Auctioned

An “original,” hand-drawn presentation map of Disneyland is one of nearly a thousand Disney-related artifacts to be auctioned on Sunday by Van Eaton Galleries. From the catalog:
This is the original presentation map of Disneyland that was created by Walt Disney and Herb Ryman in 1953. This map was then the main presentation piece for Roy Disney’s meetings with potential investors in New York, which succeeded in getting Disney the financing from ABC that was necessary to build Disneyland. This same map returned from New York and was displayed at the Disney Studio where it was used by Walt in numerous development meetings throughout the remainder of 1953 and into 1954. Later in 1954, this map received newly inked outlines and additional color, and was used as the first publicly released full-image of Disneyland. The significance of this map in the history of Disneyland cannot be overstated.
The auction ruffled a few feathers when it hit the news last month, partly because of media reports attributing the map to Disney himself, or calling it the original map, which it isn’t. Theme Park Insider notes that “[t]he original concept map of Disneyland, hand-drawn by Herb Ryman in 1953, sits safely in the archives of Walt Disney Imagineering. It’s not for sale and likely never will be.” A post on the Friends of The Walt Disney Family Museum Facebook page goes further, calling the map to be auctioned
a large-format photostat or brownline of Herb Ryman’s original drawing, which is safe and sound in the Walt Disney Imagineering Art Library. Dozens of these were made to pitch the Park to investors and participants. Shame on Van Eaton for knowingly misrepresenting a big photocopy as a valuable artifact worth a million dollars.
In a comment on that post, Van Eaton Galleries defended themselves by clarifying that the map being auctioned is the original presentation map, not Ryman’s original pencil drawing on vellum.
Vellum is a fragile paper, like a tracing paper. It’s not the kind of paper you would take to New York as your main presentation piece. What vellum is exceptionally good for though, is letting light through during the brownline process, as the “Disney historian” mentioned. The vellum pencil drawing was used to transfer the line work to this map, which was then hand colored, inked, mounted to a presentation board, and taken to New York by Roy Disney to pitch to ABC. The vellum pencil drawing was never intended to be the final product, otherwise Ryman would have drawn it directly onto a more durable paper for Roy to take. It was however, used to create the map that we are bringing to auction.
(The New York Times article on the auction was corrected to reflect that distinction. For other coverage, see ABC News and CNN, among many others.)
Update, 27 June: The map sold for $708,000 to an unknown buyer. ABC News, BBC News.
Canada’s Indigenous Communities on Google Maps
CBC News reports that more than 3,000 indigenous communities in Canada—traditional First Nations reserves as well as treaty settlement lands and urban reserves—have finally been added to Google Maps. For some reason I thought they already were—U.S. Indian reservations have been on Google Maps for some time, after all (their visibility, or lack thereof, was commented on in 2011: here, here and here).
A lot of things accumulated in my inbox during the move, and the backlog is kind of overwhelming right now, but I’ve finally updated the Map Books of 2017 page to include all the books that came to my attention during that time.
Speaking of backlogs, I still have several books in my reviewing queue, which I hope to be able to tackle soon.
And speaking of reviews: publicists should note that while my mailing address has not changed, my street address has. If you’re sending me review copies by any means other than the postal service, please contact me to get my new street address. (See also my reviewing guidelines.)
xkcd’s Relativistic Election Maps
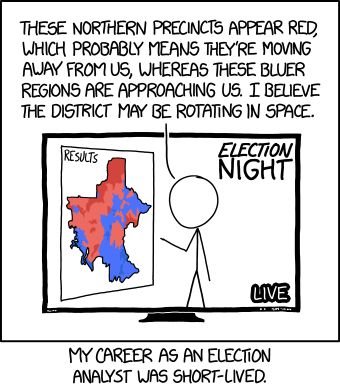
I’m surprised it took as look as it did for physics and cartography to collide—relativity and choropleth maps—in an xkcd cartoon.
The Lewis Ansbacher Map Collection
Here’s a recent piece in the Florida Times-Union introducing readers to the Lewis Ansbacher Map Collection at the Jacksonville Public Library. Ansbacher died in 2004 during negotations to donate his private collection of some 244 maps, mostly of Florida, to the library, which housed them in a dedicated space in its new main library, which opened the following year. Here’s a Times-Union piece about the collection from 2005. [Tony Campbell]
A Map of the Ideological Leanings of U.S. Congressmen

Based on data from GovTrack, this map displays the ideological leanings of current (at the time) members of the U.S. House of Representatives by their district. “The data is based of numbers from 0-1. If the congressman is a 0 he is the most liberal in the House. If a congressman is at 1 then he is the most conservative. If the congressman is a 0.5 they are centrist. […] The most conservative congressman is Jeff Duncan, a Republican from South Carolina’s 3rd District. The most liberal congressman is Barbara Lee, a Democrat from California’s 13th District.”
The Business of Making Maps for Self-Driving Cars
CNN on the big business involved in creating detailed maps—called HD maps—for self-driving cars. “If you believe self-driving cars will eventually operate everywhere, then every city and street will need to be mapped out in granular detail.” How granular? During one test, a single-pixel error on one map caused cars to avoid a patch of road as though it was raised 10 inches. [Osher]
Previously: Human-Annotated Maps for Self-Driving Cars.