How xkcd Does Maps

Randall Munroe, author of the xkcd web comic, posts a surprising amount of map-related content, which I invariably end up linking to here. With some exceptions, they fall into one of two categories, each of which has a recent example.

The first category is a hand-drawn infographic map showing, in earnest, some interesting or surprising information. See, for example, this map showing the most observed animal or plant in each U.S. state:

Randall Munroe, “iNaturalist Animals and Plants,” xkcd, 21 Jul 2025.

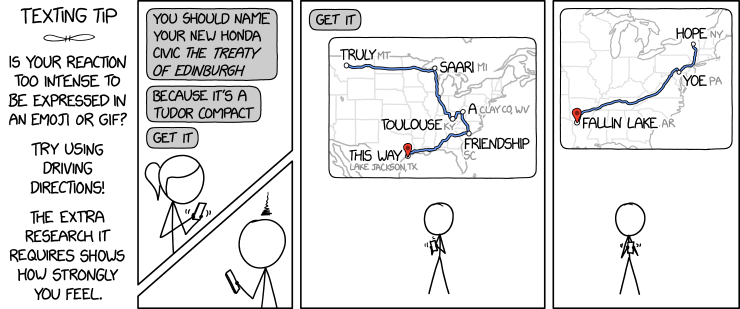
Other maps of this ilk include drainage basins, lesser-known towns sharing a famous place name, least informative Google Trends maps, and maps of the 2016, 2018 (challengers) and 2020 elections.

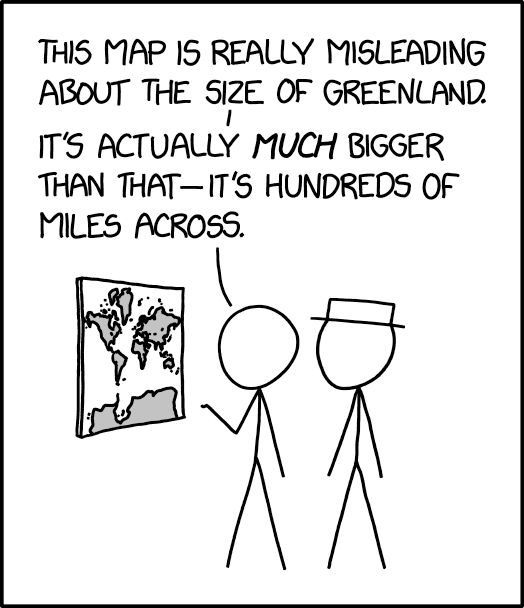
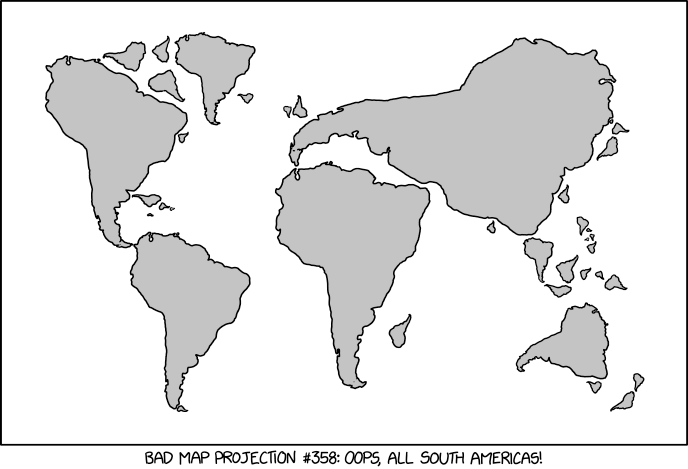
The second category is where Randall chooses the path of violence, with maps clearly designed by Black Hat Guy to hurt our brains. These include a series of maps that mangle U.S. state borders (1, 2, 3). But the most insidious are his Bad Maps Projections series, the most recent of which projects continents onto their own globes:

Randall Munroe, “Bad Map Projection: Interrupted Spheres,” xkcd, 30 Jul 2025.

Thing is, this one isn’t as brain-curdling, because similar globes—globes that depict a portion of the world on an entire sphere—exist in the real world.

A Globe Safety Tip from xkcd

Randall Munroe, “Globe Safety,” xkcd, 7 May 2025.

In Wednesday’s xkcd comic, Replogle has apparently been taken over by mad scientists. I’m having a hard time resisting the urge to explain the joke (I doubt many of my readers are physicists, but then I’m not one either). But in a weird Einsteinian way Randall is doing with globes and mass what Carroll, Borges and Eco did with maps and space: assume a 1:1 ratio between the map and the mapped.

Getting on the Name-Changing Bandwagon

Illinois governor J. B. Pritzker has decided to get in on the whole unilateral name-changing thing.

An important announcement from the Governor of Illinois.

JB Pritzker (@jbpritzker.bsky.social) 2025-02-07T20:34:44.620Z

See also Barry Blitt’s cartoon in The New Yorker.

Previously: Naming the GulfGoogle Maps to Use ‘Gulf of America’–Others Not So Much; More Reactions to ‘Gulf of America’.

xkcd: ‘Every Eclipse Path Map’

An xkcd cartoon about eclipse path maps.
Randall Munroe, “Every Eclipse Path Map,” xkcd, 17 Apr 2024.

Looks like we’re not quite done with eclipse maps, especially the whimsical sort, and it’s not at all invalid for xckd to have (what is probably going to be) the last word on the subject (at least for a while), with this fictional map showing the fictional path of a fictional eclipse over a fictional landscape, with rueful descriptions of fictional places where trying to see the fictional eclipse will come to a bad end for the fictional observers. (And you thought it was bad you got clouds.)

xkcd on Greenland’s Size

xkcd: Greenland Size (25 Mar 2024)
Randall Munroe, “Greenland Size”, xkcd, 25 March 2024.

The 25 March 2024 xkcd honours Greenland’s place as a measure of cartographic distortion. It’s also, unexpectedly, a riff on the idea of the 1:1 scale map (cf. Borges), especially if you consult the comic’s alt text: “The Mercator projection drastically distorts the size of almost every area of land except a small ring around the North and South Poles.”

Previously: xkcd: The Greenland Special.

Strange Maps on Perception Maps

Over on Strange Maps, which like this here site is still a going concern, Frank Jacobs has a nice writeup of the history of perception maps. These are maps that provide a skewed or exaggerated view, usually of the United States, that favours their preferred part of it. The best known is Saul Steinberg’s 1976 New Yorker cover (“View of the World from 9th Avenue”) but there were antecedents. Frank covers the examples I mentioned in these previous entries: McCutcheon’s View; McCutcheon’s 1908 Cartoon. Plus a few others.

A Map of Every Chinese City

Map of Every Chinese City (Alfred Twu)
Alfred Twu (CC licence)

Inspired, he says, by Itchy Feet’s maps of Every European City and Every American City, Alfred Twu has come up with a Map of Every Chinese City. (Chinese version here.) Twu is no stranger to these parts: he worked on rail maps for California and the Northeast Corridor some years back.

Previously: Itchy Feet’s Map of Every European City; Itchy Feet’s Map of Every American City.

xkcd: All South Americas

Randall Munroe, “Bad Map Projection: South America.” xkcd, 17 Jan 2020.

xkcd is back with another bad map projection: in this one, it’s all South Americas. The alt-text: “The projection does a good job preserving both distance and azimuth, at the cost of really exaggerating how many South Americas there are.”

Previously: xkcd’s Time Zone Map; xkcd’s Liquid Resize Map Projection; xkcd’s United States Map.

Itchy Feet’s Map of Every European City

Malachi Ray Rempen

The latest cartoon from Itchy Feet, a comic about travel and language by filmmaker Malachi Rempen, is a “Map of Every European City.” In the comments, the cartoonist says, “Having been to every single European city, I can safely say with confidence that they all look exactly like this.” I don’t think he’s wrong.

Another Caricature Map of Modern Europe

In December 2016 cartoonist Andy Davey created, for a private client, a modern-day “serio-comic” map of Europe in the style of the caricature maps that proliferated in the late 19th and early 20th centuries. Now he’s created another one in the same style, this one even better than the last: it features political figures in the shape of their countries, with leaders from elsewhere in the world blowing wind in Europe’s direction. Very easy to get lost in the detail here. [WMS]