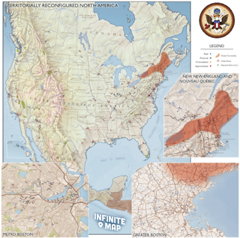
 Online and print versions of a map of David Foster Wallace’s 1996 novel Infinite Jest are now available, the latter for purchase. Both are part of William Beutler’s Infinite Atlas Project, “an independent research and art project seeking to identify, place and describe every possible location in David Foster Wallace’s Infinite Jest.” Via AppNewser and Kottke.
Author: Jonathan Crowe
Mapping Hurricane Tracks
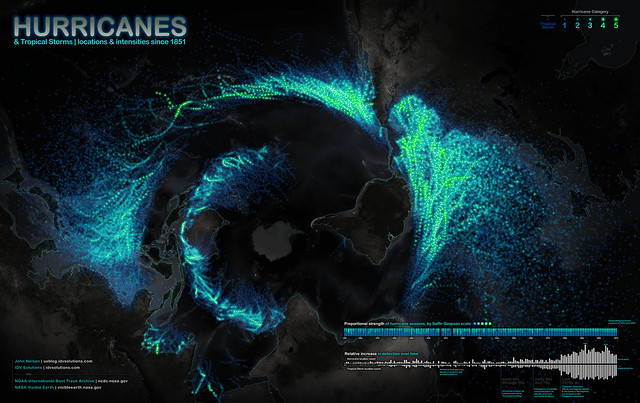
IDV Solutions, source of that map of tornado tracks across the U.S., has released a map of the paths of all known hurricanes since 1851. An added twist is that this map uses a polar azimuthal equidistant projection centred on Antarctica, creating a point of view that is unexpected and that has already created a few double-takes. Via io9.
Maps of Songs and Films
Mapping the Nation
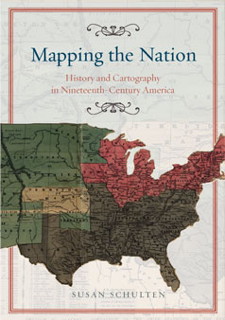
 Susan Schulten, a history professor at the University of Denver, writes to let me know about her new book, Mapping the Nation: History and Cartography in Nineteenth-Century America, out this month from University of Chicago Press.
From the publisher’s page: “Today, statistical and thematic maps are so ubiquitous that we take for granted that data will be arranged cartographically. Whether for urban planning, public health, marketing, or political strategy, maps have become everyday tools of social organization, governance, and economics. The world we inhabit—saturated with maps and graphic information—grew out of this sea change in spatial thought and representation in the nineteenth century, when Americans learned to see themselves and their nation in new dimensions.”
This sounds very interesting. Her previous book, The Geographical Imagination in America, 1880-1950, came out in 2001. I may have to pick up both: maps and the history of mentalities is too much to resist.
Kate Elliott on Fantasy Maps
Fantasy and science fiction writer Kate Elliott talks about maps. An excerpt:
I know that some love maps, some are indifferent, and some dislike them. That’s as it should be.
I personally like maps, because I’m geeky that way but also because I process information both visually and kinesthetically, and thus maps make it easier for me to negotiate certain kinds of plots. Yet with other stories, I don’t even think of wanting a map. I wonder if there is a kind of story that seems more to benefit by a map while others just don’t have any call for them.
There are narratives in which there are things about the world you can’t learn from the story but which you can glimpse if the book includes a map, so in that sense a map can add a bit of extra dimension to a world. One of the challenges of writing the Spiritwalker books in first person is that there is a lot of information about the world that can never get into the narrative because it isn’t something a) the narrator would reflect on much less know &/or b) that is necessary to the plot.
Previously: How Readers Use Fantasy Maps.
Waldseemüller Globe Gore Found

During The Map Room’s existence I frequently reported on Martin Waldseemüller’s 1507 map of the world, notable because it was the first with the name “America” on it. Dubbed, as a result, “America’s birth certificate,” the last known copy of the large, 12-section map is now on display at the Library of Congress, which paid $10 million for it.
But Waldseemüller also produced small gores, which are used to construct globes; these ones would have been about four inches across. Four of these gores were known to exist, but yesterday Ludwig-Maximilians-Universität München announced that they had accidently turned up a fifth copy in their library collection. It differs from the other gores; they believe it to be from a later edition. It can be viewed online here. BBC News coverage. Thanks to Drew for the tip.
If you’re interested in the Waldseemüller map, you’ll want to read The Fourth Part of the World by Toby Lester. I reviewed it in December 2009.
Mapping the Heat Wave

Hotter than usual? Yes. This map shows how much land surface temperatures during the week of June 17-24, 2012 have been above or below the average for 2000-2011. Now this map measures something very specific: land surface temperatures (LSTs) aren’t the same as air temperatures: “LSTs indicate how hot the surface of the Earth would feel to the touch. From a satellite vantage point, the ‘surface’ includes a number of materials that capture and retain heat, such as desert sand, the dark roof of a building, or the pavement of a road. As a result, daytime land surface temperatures are usually higher than air temperatures.” Via Bad Astronomy.
A Scholarly Work on Fantasy Maps
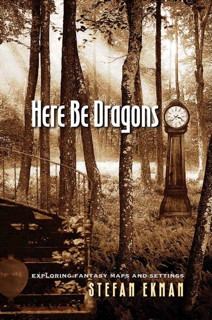
 I knew that Swedish literary scholar Stefan Ekman has been studying fantasy maps—see, for example, this blog post of his—but I only found out today (thanks to the Locus forthcoming books listings) that he has a book coming out on the subject: Here Be Dragons: Exploring Fantasy Maps and Settings will be published by Wesleyan University Press in January 2013.
The publisher calls it the “first in-depth study of the use of landscape in fantasy literature”; here’s an excerpt from their description:
In Here Be Dragons, Stefan Ekman provides a wide-ranging survey of the ubiquitous fantasy map as the point of departure for an in-depth discussion of what such maps can tell us about what is important in the fictional worlds and the stories that take place there. With particular focus on J. R. R. Tolkien’s The Lord of the Rings, Ekman shows how fantasy settings deserve serious attention from both readers and critics. Includes insightful readings of works by Steven Brust, Garth Nix, Robert Holdstock, Terry Pratchett, Charles de Lint, China Miéville, Patricia McKillip, Tim Powers, Lisa Goldstein, Steven R. Donaldson, Robert Jordan, and Neil Gaiman and Charles Vess.
I’m not sure I can overstate how much I’m looking forward to reading this. Once I do, I’ll tell you all about it.
Pre-order at Amazon: hardcover, paperback | publisher’s page
Apple Replaces Google Maps on iOS
So last week Google held a press event outlining several upcoming features and innovations in Google Maps, including the ability to use maps offline on Android (i.e., without a network connection), some pretty impressive 3D imagery, and shrinking the Street View camera so that it’ll fit in a backpack. The event was widely seen as a way to grab some of the limelight prior to Apple’s announcement of its own built-in maps for iOS, which came today (more on which in a moment).
Mapping Tornado Tracks

Using more than 50 years of NOAA data, John Nelson of IDV Solutions has created a map of tornado tracks across the United States, categorized by their F-scales (he’s also broken them out by each F-scale). Via O’Reilly Radar.
Map of a Nation
 When Rachel Hewitt’s Map of a Nation was published in the U.K. in 2010, I despaired of ever being able to lay hands on a copy easily. A book documenting the first century or so of the history of the Ordnance Survey, Britain’s national map-making body, is not likely to have much commercial potential outside Britain:
 no surprise that a U.S. edition has not come out. [Update: A paperback edition became available in the U.S. in 2013, after this review was posted.] But I recently discovered that, like at least one other book otherwise unavailable on this continent, it is available to North Americans as an ebook (and has been for a year: see how observant I am). So spent the $10, downloaded it to my Kindle, and settled in to read a book I’d heard about for years but didn’t imagine I’d be able to lay hands on without some effort.
Inasmuch as a history of field surveying and copper-plate engraving can be made anything other than dull, Hewitt has managed to produce a narrative that fairly crackles with interest. She starts at the bloody Battle of Culloden, not only as a way of setting the stage for the Military Survey of Scotland, a predecessor to the OS, but also as a rationale for mapping the whole of Britain’s territory in the first place. From there we’re led through the Scottish Highlands, joint French-British observations to measure the distance between their observatories, the triangulation of Britain and the survey of Ireland. The narrative closes with the publication of the last maps of the First Series and the expansion of the OS’s works into city maps. Along the way we get glimpses into the equipment used in the survey, such as the theodolite, and the mapmaking process; there’s a lovely section on how the OS dealt with Irish placenames, and digressions into art and poetry.
It does read a bit traditionally, in the sense that it is an institutional history seen through the lens of those in charge. It’s a history of those making the maps; the impact of those maps is less thoroughly covered. And if you ask me, it ends too soon—just as the OS is getting started. A lot more could still be written, I think.
Previously: Forthcoming History of the Ordnance Survey; Map of a Nation: Hewitt’s History of the Ordnance Survey Is Now Available.
Amazon (Canada, UK) | Apple Books
Apple to Abandon Google Maps in iOS 6?
There are rumours that for iOS 6, the next version of the operating system for the iPhone, iPad and iPod touch, Apple will replace Google Maps with an in-house mapping application with an impressive 3D mode; the app will apparently “blow your head off,” to quote John Paczkowski’s source. Much is being made of the 3D mapping possibilities, thanks to Apple’s acquisition of C3 Technologies. My interest, and my concern, is with the base mapping data. If this is going to be a flagship product, and signs point to that being the case, Apple can’t use OpenStreetMap (as it does with the iOS iPhoto app), at least not exclusively: it’s still not ready. It would be better, but not cheaper, if Apple used Navteq or Tele Atlas map data directly; when Google abandoned them for their own map data, Google Maps’ quality did not universally improve. (AppleInsider, Daring Fireball, TUAW.)
Does a Map Reveal Roanoke’s Fate?
A patch on a 16th-century map may suggest what happened to the lost colony of Roanoke. The map in question is the 1585 Virginea Pars map by John White. Based on the patch, which hides a symbol indicating a fort, researchers argue that the settlers may have moved westward and inland. AP coverage: ArtDaily, CBC, Washington Post. Via io9.
U.S. Life Expectancy by County

County-by-county life expectancy estimates released last month by the Institute for Health Metrics and Evaluation reveal a startling gap between the longest-lived and shortest-lived areas of the country: the difference can be as much as 15 years.
The range of life expectancies is so broad that in some counties, such as Stearns, Minnesota, lifespans rival some of the places where people live the longest—Japan, Hong Kong, and France—while in other counties, life expectancies are lower than places that spend far less on health care—Egypt, Indonesia, and Colombia. Even within states, there are large disparities. Women in Fairfax, Virginia, have among the best life expectancies in the world at 84.1 years, while in Sussex, Virginia, they have among the worst at 75.9 years.
And the situation isn’t improving either: “In 661 counties, life expectancy stopped dead or went backwards for women since 1999. By comparison, life expectancy for men stopped or reversed in 166 counties.” When people refer to the U.S. as a Third World country, this sort of thing—the disparity, the decline—is usually one of the reasons why. Via Tobias Buckell.
New Moon Globe Released
 Calling it “the first entirely new globe of the lunar surface in more than 40 years,” Sky and Telescope has announced a new Moon globe based on Lunar Reconnaissance Orbiter imagery. Replogle’s Moon globe has been the standard for decades, but it’s based on 1960s-era charts and, as I said in my review three years ago, doesn’t have a lot of contrast and doesn’t look much like the Moon. Mind you, the new globe costs almost twice as much.


