
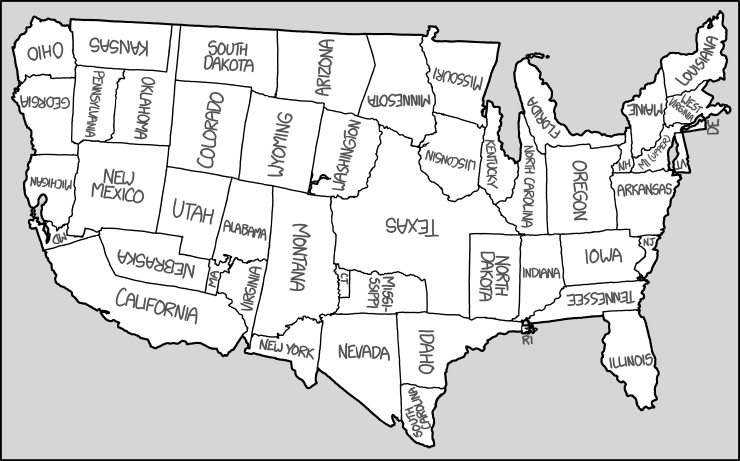
Today’s xkcd is a map of the United Sta—wait … what has Randall done? My eyes … they’re bleeding.
Today’s xkcd is a map of the United Sta—wait … what has Randall done? My eyes … they’re bleeding.
Something worth mentioning on International Women’s Day: the Boston Public Library’s exhibition, Women in Cartography: Five Centuries of Accomplishments, opened last October and runs until 26 March at the Central Library’s Leventhal Map Center. The exhibition can also be viewed online.
A few books about women in cartography:

Previously: Two More Map Books; Soundings: A Biography of Marie Tharp; The Urban Legend of Phyllis Pearsall; Phyllis Pearsall.
Mapping the Past: GIS Approaches to Ancient History, a conference hosted by the Ancient World Mapping Center (the folks behind the Barrington Atlas), takes place at the University of North Carolina, Chapel Hill, from 7 to 9 April 2016. It’s open to the public. Here’s the full schedule. [via]
Previously: Antiquity à la Carte.

The Aspen Daily News has a profile of map artist James Niehues, who’s painted hundreds of different aerial views of ski resorts and recreational areas since the late 1980s. (If you’ve seen a poster of your local ski resort, odds are Niehues was the one who painted it. He sells prints of them, too.) The article names Niehues as heir to an artistic tradition of alpine cartographic art whose practitioners included Hal Shelton and Bill Brown.
Without knowing it, Niehues had become heir to an American artistic dynasty. Shelton was trained as [a] U.S. Geological Survey cartographer and produced a large number of famous trail maps in the 1960s and 1970s. In the ’70s, Shelton passed the torch to Brown, and by 1988, Brown was ready to pass the torch off to someone else.
In the early 2000s, though, it seemed that the storied line of American mountain illustrators would end with Niehues. His maps, many of which had faithfully represented ski trails for decades, began to be replaced by digitally rendered pieces whose production values placed speed above quality.
But there’s a twist: one of the digital illustrators, Rad Smith, ended looking to Niehues for inspiration and mentorship. Demand for painted maps turns out to be more resilient; Niehues, who I believe is in his late sixties and has described himself as semi-retired, may have someone to pass the torch to after all. It’s a fascinating read. [via]
Previously: James Niehues’s Ski Resort Maps; James Niehues Profile.
The Book Riot piece I linked to in January by A. J. O’Connell dealt with the editorial decision on whether to include a map in a fantasy novel. That article appears to have followed up on O’Connell’s piece from last August, which I missed. It explores why some fantasy authors may or may not be fans of maps (Terry Goodkind, for one, calls them a distraction), and how they decide whether to include them with their novels. Authors discussed include Joe Abercrombie and N. K. Jemisin, both of whom added maps to later books after earlier books went without; in each case, though, the map served a purpose, and not just to signify that yes, it’s an epic fantasy novel because look! it has maps on the endpapers.
O’Connell also points to the hilariously snarky, must-read Bigass Things I Hate In Fantasy Maps Post by XenkanMonk, which should probably be read in tandem with the Bigass Fantasy Maps I Love Post. [via]
Previously: Book Riot on Fantasy Maps; A Fantasy Map Roundup.

FiveThirtyEight maps the Facebook likes of the U.S. presidential candidates: “If Facebook likes were votes, Bernie Sanders would be on pace to beat Hillary Clinton nationwide by a nearly 3-to-1 margin and Donald Trump to garner more support than Ted Cruz and Marco Rubio combined. Anything seems possible this year, but, still, be careful how you interpret these numbers: Facebook likes are not votes.” They ain’t kidding—Ben Carson?! [via]
Three years ago Alejandro Polanco (who blogs about maps in Spanish at La Cartoteca) launched Maptorian, a collection of editable vector maps aimed at graphic designers, journalists, teachers, students and others who need to make maps, know how to use applications like Adobe Illustrator but don’t have a GIS background. Now a Kickstarter campaign has launched for the improved-expanded-updated sequel, Maptorian Plus. Read Alejandro’s post (in Spanish).

Joseph Berkner’s One Line—One Map—One World is a map of the world drawn in a single line.
In mapping, lines are (mostly) used as borders to divide the space in sections: borders between land and water, borders between different altitudes or borders between nations. As a person who loves to make maps, for the last weeks I was thinking about what I can do to draw a line to CONNECT instead of DIVIDE. So I created a world map consisting of a single line. When watching the map from far away you cannot see the connections. It looks like everything is divided. But if you go closer you can see that everything is one. To realize that we are somehow all one community you need to go close to others.
The map is available for purchase as a print or digital download.

More than 25,000 Syrian refugees have now arrived in Canada. To mark that milestone, Canadian newsweekly Maclean’s has created an interactive map showing where those refugees have settled.
 When I reviewed the Ninth Edition of the National Geographic Atlas of the World in 2010, I compared it virtually plate-by-plate with the Eighth Edition. With the Atlas’s Tenth Edition, which came out in the fall of 2014, Christine Newton Bush does something similar in her review for Cartographic Perspectives: emphasize what’s new and changed. When you have a reference product that updates every few years, people may well wonder each time a new edition comes out whether now is the time to replace their older copy, so this approach makes a lot of sense. And not just because I’ve done it myself. Buy at Amazon.
Of the maps of the Democratic and Republican U.S. presidential primary and caucus results I’ve seen so far, I rather like the county-by-county maps done by Reddit user Mainstay17. Here’s one for the Democrats that includes the results from the Super Tuesday states:

And here’s the equivalent map for the Republicans:

(Before you start, errors have already been pointed out in the Reddit comments here and here. Presumably there will be updates.)

Two important seventeenth-century world maps are the focus of a new exhibition opening this Friday at the Asian Art Museum in San Francisco. China at the Center: Rare Ricci and Verbiest World Maps, which runs from 4 March to 8 May 2016, features Matteo Ricci’s 1602 map and Ferdinand Verbiest’s 1674 map.
Ricci (1552–1610) and Verbiest (1623–1688) were both Jesuit priests, in China to spread Christianity; their maps, produced in collaboration with Chinese calligraphers, artists and printers, produced a fundamental rethinking of China’s place in the world. Not that China wasn’t at the centre of these maps, as the essays in the accompanying catalogue point out, but these maps filled out the rest of the world, which was previously a marginal afterthought in Chinese cartography.

YouGov’s eurosceptic map of Britain measures the level of euroscepticism in the regions of England, Wales and Scotland in the run-up to the U.K.’s upcoming EU referendum. “New YouGov research using the profiles data of over 80,000 British people on the YouGov panel reveals the most and least Eurosceptic areas of Britain, down to the finest detail our data will allow. There are 206 local education authorities in England, Scotland and Wales, 188 of which we have large enough samples to report a position on the EU.” [via]

A high-quality scan of a 1967 map of Paris’s pneumatic tube network, which remained in service until 1984. [via]

Using an online colour blindness simulator, Reddit user kalsoy has created the above image showing how map colours are perceived by people with various forms of colour vision deficiency. [via]
Previously: Ordnance Survey Announces Colour-Blind Map Style; Ordnance Survey Announces Colour-Blind Mapping.