
The City of Boston’s planning department has a room with a 1:40 scale model of downtown Boston and surrounding neighbourhoods. The Leventhal Center’s Facebook page has a few more photos. (Update: Bluesky, Instagram.)
Category: Unusual Maps
A Tool to Generate Tactile Street Maps
Speaking of tools for generating maps for the blind and visually impaired (previously), there’s also TMAP (Tactile Maps Automated Production) from Lighthouse’s MAD Lab.
TMAP is a screen reader-friendly tool for creating tactile street maps. Raised lines and textures represent roads, pedestrian paths, and railways. Maps range from a few blocks to a few miles wide.
Map creation is automated; you do not have to design and label maps. Simply enter an address, intersection or landmark into the search bar. Then choose settings for paper size and map scale, and which features to include on the map.
The maps can be ordered from Lighthouse’s store or printed on an embosser or tactile printer (as opposed to a 3D printer). Thanks to Fred DeJarlais for the tip.
3D Printed Tactile Maps
Touch Mapper is an open source project (GitHub) for generating 3D printed tactile maps for the visually impaired. The maps use OpenStreetMap data and produce a file that can be printed on almost any 3D printer, or ordered for a fee. The project started nearly a decade ago but I only stumbled across it today.
Previously: 3D Printed Maps for the Blind and Visually Impaired.
‘A 50/50 US/Australia Blend’ from xkcd

Morphing maps of the U.S. and Australia into one hot mess is more of a Star Trek transporter accident than a map projection, if we’re being nitpicky; what’s surprising is that the result is almost viable. Almost.
‘An Impossibly Heavy, Large Silver Globe’
“Of all the globes in the Geography & Map Division’s collections, there is one that has always caught my eye: an impossibly heavy, large silver globe tucked away in our stacks, that stands without any depiction of the earth’s physical features at all. The large silver orb instead displays only a coordinate system grid composed of unlabeled latitude and longitude lines.” Meagan Snow writes about the unlikeliest of globes in the Library of Congress’s collection: a precisely machined 34-inch blank metal globe. What on earth it was it used for? Answer unclear: “The intended use of the globe is described as ‘for earth study.’”
xkcd: ‘Exterior Kansas’

In the latest iteration of xkcd’s series of bad map projections, Randall puts Kansas—the putative centre of the contiguous 48 states—at the edge of the map.
The Geochron, and How One Was Restored
The Geochron has been around since the mid-sixties and I only just learned about it this week. It’s an analog, electromechanical world clock and map. The backlit, translucent map is motorized: it scrolls from left to right to indicate the rotation of the earth. Noon is at the centre of the map. The terminators actually change to reflect the change in seasons, as does the position of the overhead sun, which moves in an analemma: these are physical objects behind the map that block the light and are geared to run on an annual cycle. Again: this thing is electromechanical.
The mind boggles, and not just at the (current) mid-four-figures price tag—which is to say that they’re still making these things. (They also have a digital version you can plug into a 4K TV [Amazon] which at $500 seems expensive for what it is. But then the Geochron itself always was. These things have never been anything other than executive- or installation-grade luxury goods.)
Anyway, Matthew Dockrey of Attoparsec managed to lay hands on a used one from the eighties and went through the process of restoring it—replacing worn parts, updating the maps and so forth—and documented it in this 21-minute video. [MetaFilter]
Why Oh Why Does an Alphabetical Cartogram Have to Be a Thing?

More proof that Randall hates us and wants to hurt our eyes comes from last Wednesday’s xkcd, which does what I’m pretty sure no cartogram has ever done: size by alphabetical order.
xkcd’s Geography Challenge
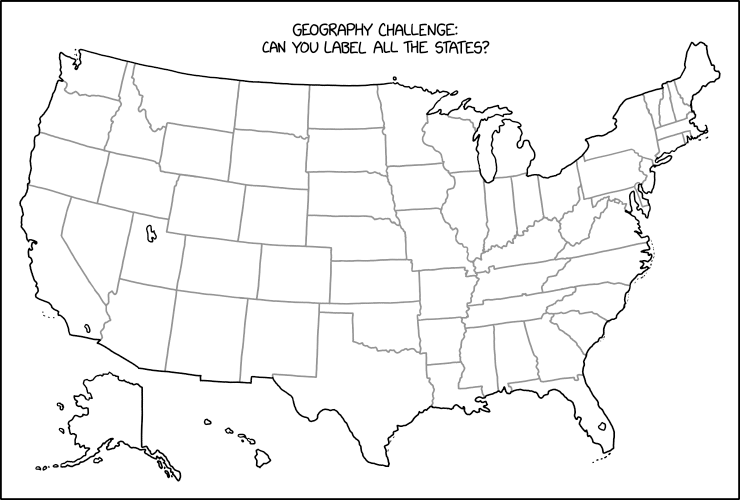
Stare at this map for a while until you figure out what Randall Munroe has done in last Friday’s xkcd. Then scream. (Kottke says: “This is evil.”) It’s not the first time that xkcd has committed mischief and violence on an outline map of the contiguous United States: see, for example this one, or this one. I worry it may not be the last.
Previously: xkcd’s United States Map; The Contiguous 41 States—Wait, What?
The Michigan Mitten, Orthorectified
The lower peninsula of the U.S. state of Michigan is often called the mitten, for its resemblance to a human hand, and apparently Michiganders indicate where they’re from by using their hands as a rudimentary map of the state. The upper peninsula too. See Strange Maps. Now John Nelson has taken this entirely too far: he’s made the Michigan hand map geographically accurate.
The Lake District in Lego
BBC News has the story of Jon Tordoff’s 100-square-foot scale model of the Lake District, which he built during lockdown out of LEGO pieces.
More on Tactile Maps
The Bodleian Map Room Blog (no relation) has a nice look at some tactile maps for the visually impaired, with some interesting 20th-century examples of the form, such as 3D relief maps, a globe, and braille maps.
Previously: Tactile Maps, Modern and Historical; A 19th-Century Tactile Map.
Strange Maps on Perception Maps
Over on Strange Maps, which like this here site is still a going concern, Frank Jacobs has a nice writeup of the history of perception maps. These are maps that provide a skewed or exaggerated view, usually of the United States, that favours their preferred part of it. The best known is Saul Steinberg’s 1976 New Yorker cover (“View of the World from 9th Avenue”) but there were antecedents. Frank covers the examples I mentioned in these previous entries: McCutcheon’s View; McCutcheon’s 1908 Cartoon. Plus a few others.
The Challenger Map Re-Emerges; Fundraising Campaign Under Way
The iconic Challenger map—a 26×24-metre exaggerated relief map of British Columbia made of nearly a million pieces of jigsaw-cut plywood, is now on display at the B.C. Sports Hall of Fame as part of an exhibition on the early days of the Pacific National Exhibition, where the map was on display between 1954 and 1997. This is only for a few months; its appearance part of a fundraising campaign to restore the map.
Previously: Challenger Map Gets Reprieve; Challenger Map Update; Another Challenger Map Update; Challenger Map Back on Display, Sort Of.
States of Confusion
Richard Peter Johnson has been posting quizzes on Reddit where the shapes of countries and U.S. states are flipped, rotated and/or inverted and you’re challenged to identify them. It’s actually harder than you might think—especially when they’re inverted or mirror-flipped—and messes with your perception in the way that, say, upside-down world maps do.